Emissions of nutrients
Nitrogen
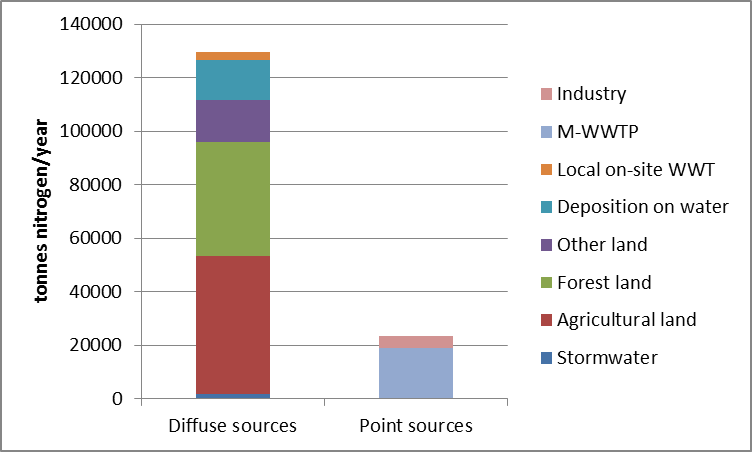
The total estimated load of nitrogen to water is about 150 000 tonnes/year and the sources such as agriculture, forests and other land are most significant. Emissions from point sources (wastewater treatment plants and industries) represent about 15 % of the total load of nitrogen to water, see figure 13.

Figure 13. Annual load of nitrogen to water divided by source.
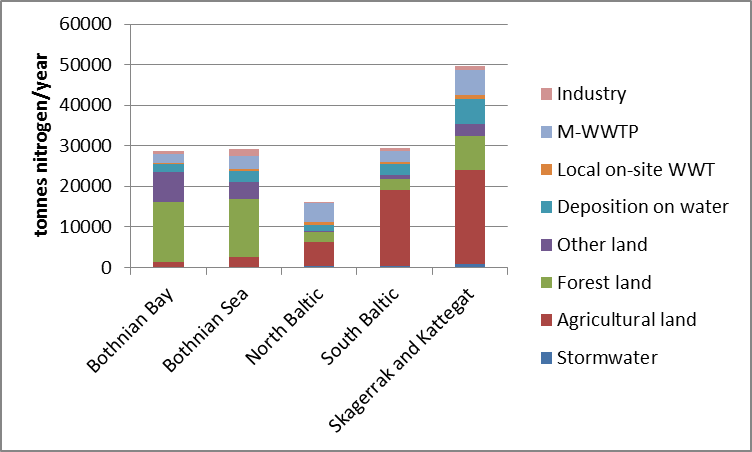
In figure 14, the load of nitrogen per river basin district and source is shown. Sources such as storm water, local on-site wastewater treatment and industrial activities have a minor contribution to the total load in each river basin district. Leaching from forests represents about 50 % of the total load in the two northern districts, whereas the contribution from forests is about 40-60 % of the total load in the three southern districts. Emissions from wastewater treatment plants represent about 30 % of the total load of nitrogen in the North Baltic river basin district and 10 % in the other four districts.

Figure 14. Annual load of nitrogen to water divided by river basin district and source.
Phosphorous
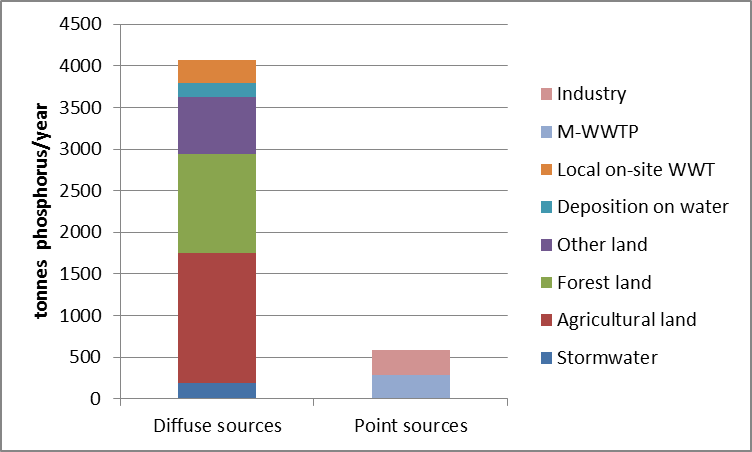
The total estimated load of phosphorous to water is about 4 700 tonnes/year and the contribution from agriculture, forests and other land is most significant. Emissions from point sources (wastewater treatment plants and industrial activities) represent about 13 % of the total load of phosphorous to water, see figure 15.

Figure 15. Annual load of phosphorous to water divided by source.
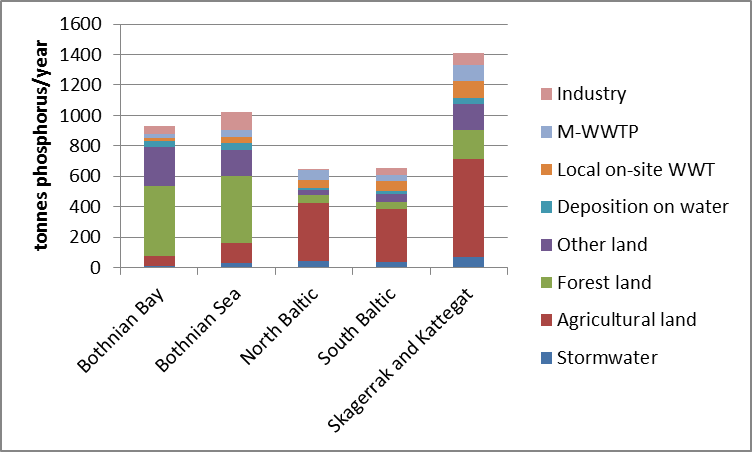
In figure 16, the load of phosphorous per river basin district and source is shown. Sources such as stormwater and atmospheric deposition contribute only to a small extent to the total load in each river basin district. Leaching from forests is approximately 40-50 % of the total load in the two northern districts, whereas the contribution from agriculture represents about 50-60 % of the total load in the tree southern districts. Emissions from wastewater treatment plants and local on-site wastewater treatment contribute each 10 % of the total load of phosphorous in the three southern districts. The largest load to water from industrial activities (approximately 10 %) occurs in the Bothnian Sea river basin district.

Figure 16. Annual load of phosphorous to water divided by river basin district and source.
